ParkerGale Indices: A Look Back at 2024 Results and Near-Term Catalysts
Summary
We’re updating our indices that track public software companies, recapping full-year results, and sharing outlooks for 2025. Three months into the new year, investors are contending with heightened market uncertainty, largely driven by the new administration. When I hear “increased uncertainty,” I start by pinpointing which growth drivers have become murkier—because when confidence in catalysts fades, we should expect more volatility in valuations. Let’s explore a few near-term trends we're watching.
The federal government has been inconsistent on the scope and timing of tariffs across sectors and regions, leaving investors unsure about which parts of the economy could face pressure on growth and pricing. Policymakers recently reduced GDP growth projections compared to December which likely accounted for this inconsistency.
Unemployment has remained stable overall, but white-collar sectors—key consumers of enterprise software—have seen elevated joblessness. This shift affects software demand, and recent surveys from IT and software firms indicate only moderate spending growth in 2025, still below pre-COVID benchmarks.
In turn, the market has shifted to a “risk-off” stance, illustrated by declines in major software indices since the start of the year. Analysts are hunting for fresh growth drivers, but macroeconomic conditions aren’t providing much support—particularly for vendors tied to federal, education, or other vulnerable sectors. Forward-looking growth rates continue to hover in the low double digits for the software companies we track.
Last year, analysts were hopeful for a growth rebound. But unless there’s a significant catalyst—like multiple sharp interest rate cuts, which now seems unlikely—broad acceleration appears out of reach. For now, modest growth and average historical valuations seem like a reasonable base case.
But what about AI?
One part of the software market that’s bucking this trend is AI. Demand for AI software solutions remains resilient in the near to medium term. It’s been over two years since OpenAI launched ChatGPT and its premium version, sparking massive investment in AI infrastructure and applications.
As software investors, we dug into how much AI is contributing to revenue at key providers. Given their scale and enterprise reach, these players offer a useful lens on early AI adoption.
So far, Microsoft’s AI business has reached a $13 billion annualized run rate, driven largely by inference and post-training workloads, rather than pure CoPilot revenue. Google Cloud revenue in the fourth quarter was $12 billion which included core GCP products, AI Infrastructure, and Generative AI Solutions. Amazon reported a multibillion-dollar annualized revenue run rate business in AI growing at triple-digit rates year-over-year.
Among more focused software vendors, Salesforce has touted its Agentforce platform and $900 million in Data Cloud and AI annual recurring revenue—up nearly 120% year-over-year. ServiceNow reported strong traction for its AI-powered Pro Plus offerings in ITSM, CSM, and HRSD, with 150% quarter-over-quarter growth in customer deals. Palantir’s AI tools helped drive 54% year-over-year growth in US commercial revenue in Q3 2024.
I hypothesize that most current AI software customers skew larger. Most customers of AI solutions today are likely enterprise-grade. And we can better assess the true underlying demand once small and mid-sized businesses increase their adoption. Especially because they represent a majority of US businesses. As Satya Nadella recently put it, “at some point, the supply and demand have to map.” But despite headwinds elsewhere, several major software providers are already seeing meaningful gains from AI offerings.
How Valuations Reacted After 2024
EV/Sales
Last twelve month sales multiples for ParkerGale Middle Market Buyout (PGMM) were 8.1x revenue for 2024 while sales multiples for ParkerGale Growth Equity (PGGE) increased to 18.4x on average (15.6x at the median). PGGE traded at a premium over PGMM and the iShares Expanded Tech-Software Sector ETF (IGV) which averaged 9.6x revenue.
The line chart below contains sales multiples for PGMM and PGGE compared to IGV. PGGE companies have increased profitability levels again while growth is decelerating.

This quarter, 27 out of 80 PGMM companies were valued at 10x EV/Sales or higher. Those companies grew revenue 14%, had EBITDA margins of 36%, and traded at 41x EBITDA, a premium over the PGMM index. In PGGE, 11 companies were valued at 10x EV/Sales or higher and grew revenue on average 31% with EBITDA margins of 27%. Profitability for the subsegment of PGGE increased again and the cohort traded at a premium to PGGE, averaging 21.5x EV/Sales.
The average LTM sales multiple in 2024 for PGMM-SC was 3.5x. No companies met the threshold for inclusion in PGGE-SC at the end of 2024.

YoY Sales Growth
Below we chart annual sales growth. Revenue growth for PGGE ended 2024 at 31% (vs 36% a year ago) while PGMM revenue growth was in line at 14%.

Throughout 2024, management teams guided, and many investors anticipated high-teens next twelve-month revenue growth rates for software companies with increasing profitability. That trend came to fruition for the most part last year as growth remained under pressure outside a few beneficiaries.
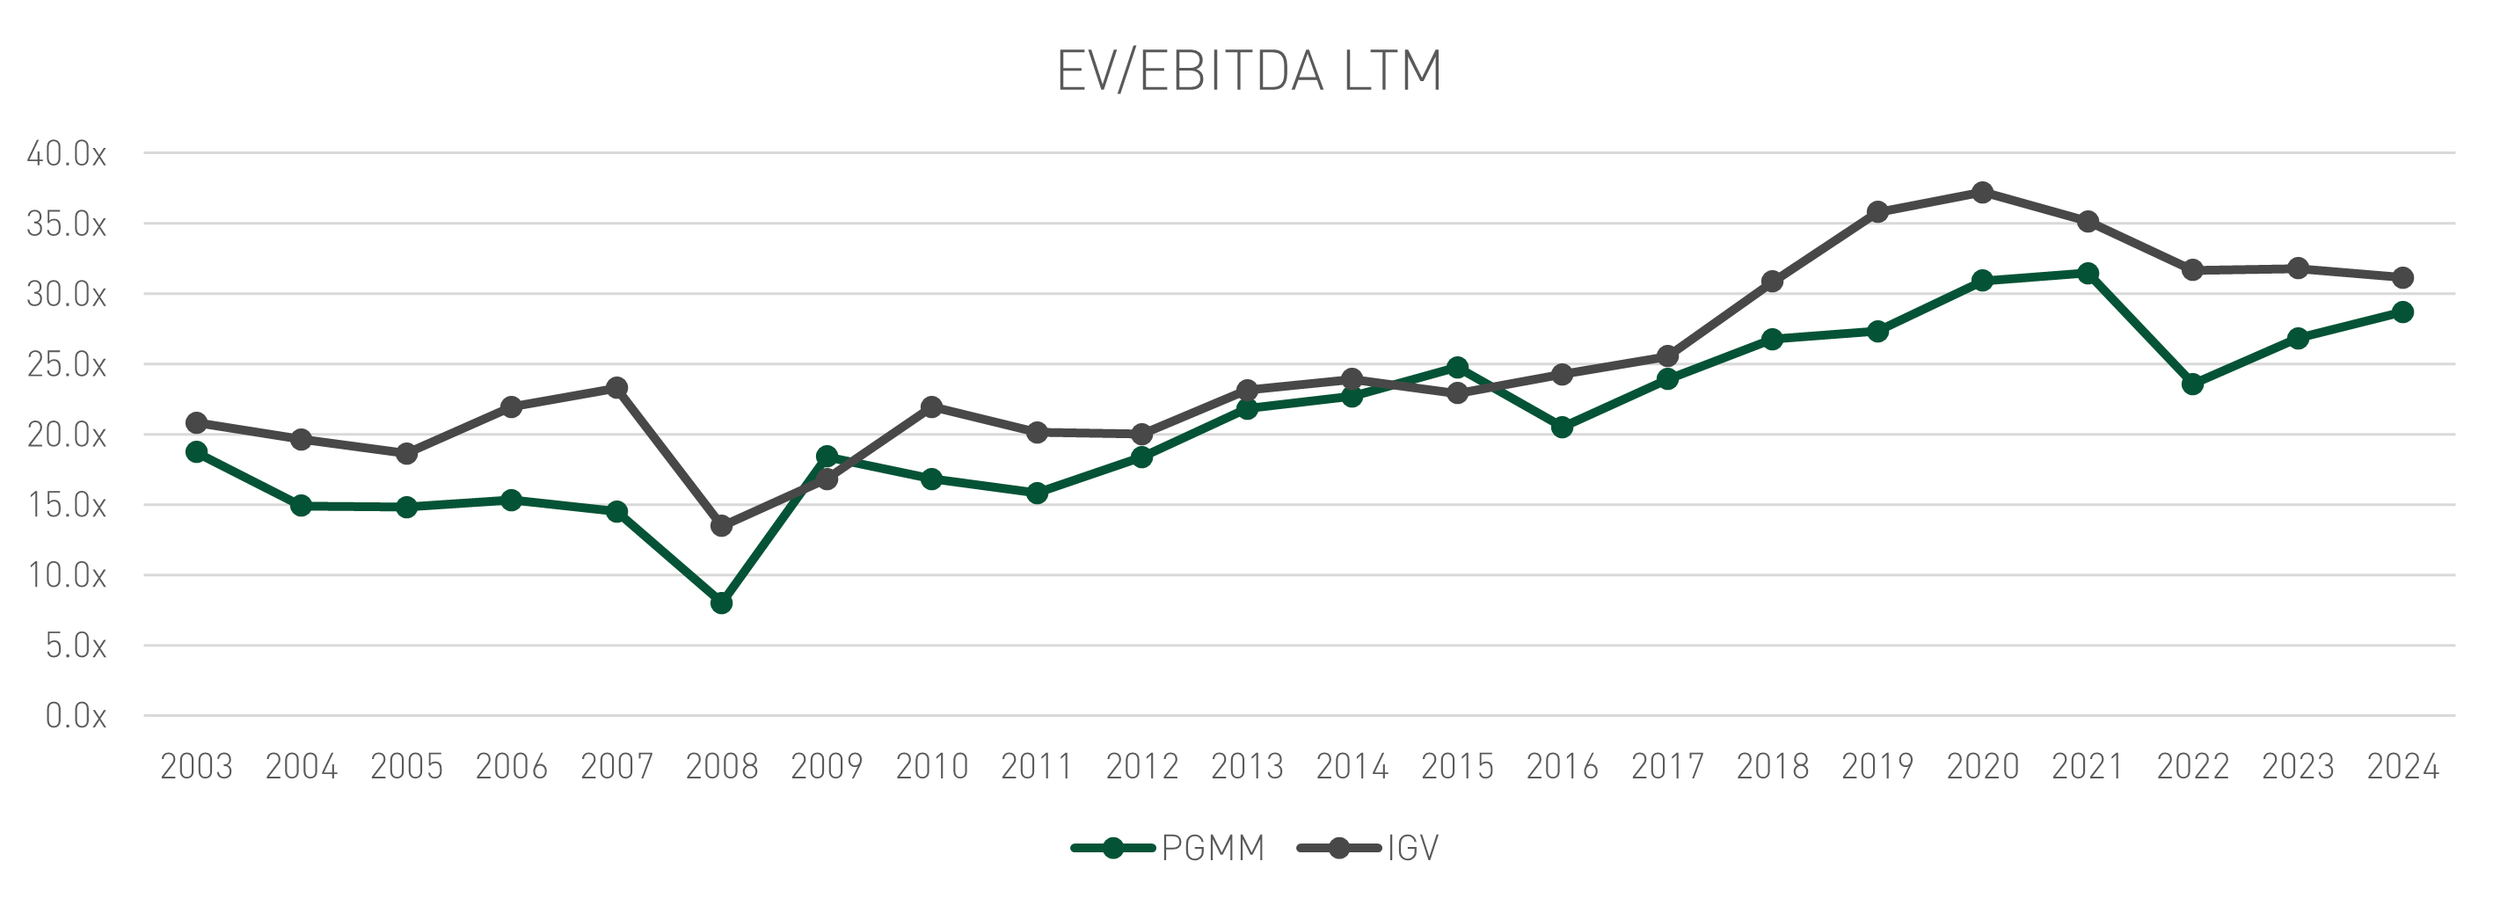
EV/EBITDA
Finally, we examine EBITDA margins and multiples for our indices. EBITDA multiples for PGMM were 28.7x and margins ended the year at 30%. PGMM-SC had margins of 12% on average and traded at 25.3x EBITDA.
The PGGE cohort increased in profitability this quarter, achieving 21% EBITDA margins. PGGE companies that were able to exceed the group EBITDA margin average commanded a premium valuation. Next twelve-month growth rates at the end of the time of writing are 30% for PGGE and 16% for PGMM.

We revisit the historical Rule of 40 to map how companies are achieving the metric. PGMM has consistently stayed in the high 20% EBITDA margin range and teens revenue growth range. Over time, PGGE has decelerated in growth and relied more on EBITDA margins to achieve Rule of 40.


PGMM growth rates are still stable, which isn’t surprising given that 20% revenue growth has become aspirational for many public software companies. As a result, valuation changes throughout the year did not vary widely.
Background on Our Indices
Here is a recap of each index:
PG Growth Equity (PGGE): All public software companies that grew over 25% in a given calendar year irrespective of profitability.
PG Middle Market Buyout (PGMM): All public software companies that grew between 5% and 25% in a given calendar year, while also maintaining at least 10% EBITDA margins in the same year.
PG Growth Equity Small Cap (PGGE-SC): Public software companies with a market cap between $250 million and $2 billion that grew over 25% in a given calendar year irrespective of profitability.
PG Middle Market Buyout Small Cap (PGMM-SC): Public software companies with a market cap between $250 million and $2 billion that grew between 5% and 25% in a given calendar year, while also maintaining at least 10% EBITDA margins in the same year.
We refreshed the data as of March 21, 2025 to capture full year 2024 actuals in our charts for trailing sales and EBITDA multiples, revenue growth, and EBITDA margin.
Disclosures
Actual financial data and estimates for the calendar year ending 2024 were pulled from FactSet as of 3/21/2025.
Investing involves risk, including the loss of all or a significant portion of amounts invested. Past performance is not a guarantee of future results.
The information contained herein is for informational purposes only and should not be considered investment advice. Opinions, estimates, forecasts, and statements of financial market trends that are based on current market conditions constitutes our judgment and are subject to change without notice. All information with respect to industry data has been obtained from sources believed to be reliable and current, but accuracy cannot be guaranteed. Certain economic and market information contained herein has been obtained from published sources and/or prepared by other parties and current as of the date of publication shown.
Investors cannot invest directly in an index. Indices may change over time. Indices are not an investment and, therefore, have no investment performance history. Index performance does not include risks, fees, or other costs. Past index performance is no indication of future results for the index or for any investment.
IWM-Tech – Consists of all Packaged Software stocks as classified by FactSet within the iShares Russell 2000 ETF (IWM). The iShares Russell 2000 ETF (IWM) seeks to track the investment results of an index composed of small-capitalization U.S. equities.
IGV - iShares Expanded Tech-Software Sector ETF – The iShares Expanded Tech-Software Sector ETF seeks to track the investment results of an index composed of North American equities in the software industry and select North American equities from interactive home entertainment and interactive media and services industries.