ParkerGale Indices: First Quarter 2024 Earnings Update
What We’re Updating
Today we are updating our indices that we developed in “What’s a Software Company Worth?”. Here is a recap of each index:
PG Growth Equity (PGGE): All public software companies that grew over 25% in a given calendar year irrespective of profitability.
PG Middle Market Buyout (PGMM): All public software companies that grew between 5% and 25% in a given calendar year, while also maintaining at least 10% EBITDA margins in the same year.
PG Growth Equity Small Cap (PGGE-SC): Public software companies with a market cap between $250 million and $2 billion that grew over 25% in a given calendar year irrespective of profitability.
PG Middle Market Buyout Small Cap (PGMM-SC): Public software companies with a market cap between $250 million and $2 billion that grew between 5% and 25% in a given calendar year, while also maintaining at least 10% EBITDA margins in the same year.
We refreshed the data as of June 23, 2024 to capture first quarter actuals in our charts for trailing sales and EBITDA multiples, revenue growth, and EBITDA margin. We will also discusseconomic data and company outlooks across the four indices to understand trends for 2024.
Before We Dive In
The sixth edition of this series marks two years of analyzing our indices. In the original version, we built indices to understand the difference in valuation between high growth companies and slower growth but profitable companies. Since then, growth outlooks have suffered for many software companies. Tightening budgets, a higher interest rate environment, and muted demand by enterprise buyers have all contributed to slower growth rates. And so far, management teams have not instilled confidence in sell-side analysts that growth will reaccelerate.
Since inflation and the Federal Funds target rate have stabilized, analysts have shifted their focus from interest rates towards company budgets. Tighter budgets drive elongated sales cycles. Some companies have shifted budgets to invest in AI. Yet, the revenue contribution from those investments remains to be seen. Additionally, companies continue to improve profitability levels, mirroring continued reporting on the difficult job market in software.
This first quarter earnings cycle drove pockets of negative stock reaction among tech stocks. The magnificent seven continued to drive outperformance during the beginning of the year for broader indices. But overall optimism is waning with stock prices reflecting that.
Businesses with consumption and seat-based models experienced downward pressure on their stock prices, especially those that sell to other software companies. The cost rationalization I called out last quarter has manifested in the aforementioned budget shifts. Again, this reaffirms my belief that we will see a prolonged period of ‘doing more with less’, bolstered by the hopes that AI will allow companies to reaccelerate revenue growth or optimize cost structures.
I continued to believe that analysts are readjusting growth expectations and that 20% growth remains a suitable floor for high growth names. But we are unlikely to see the high fliers of yesteryear.
How Valuations Reacted After the First Quarter
EV/Sales
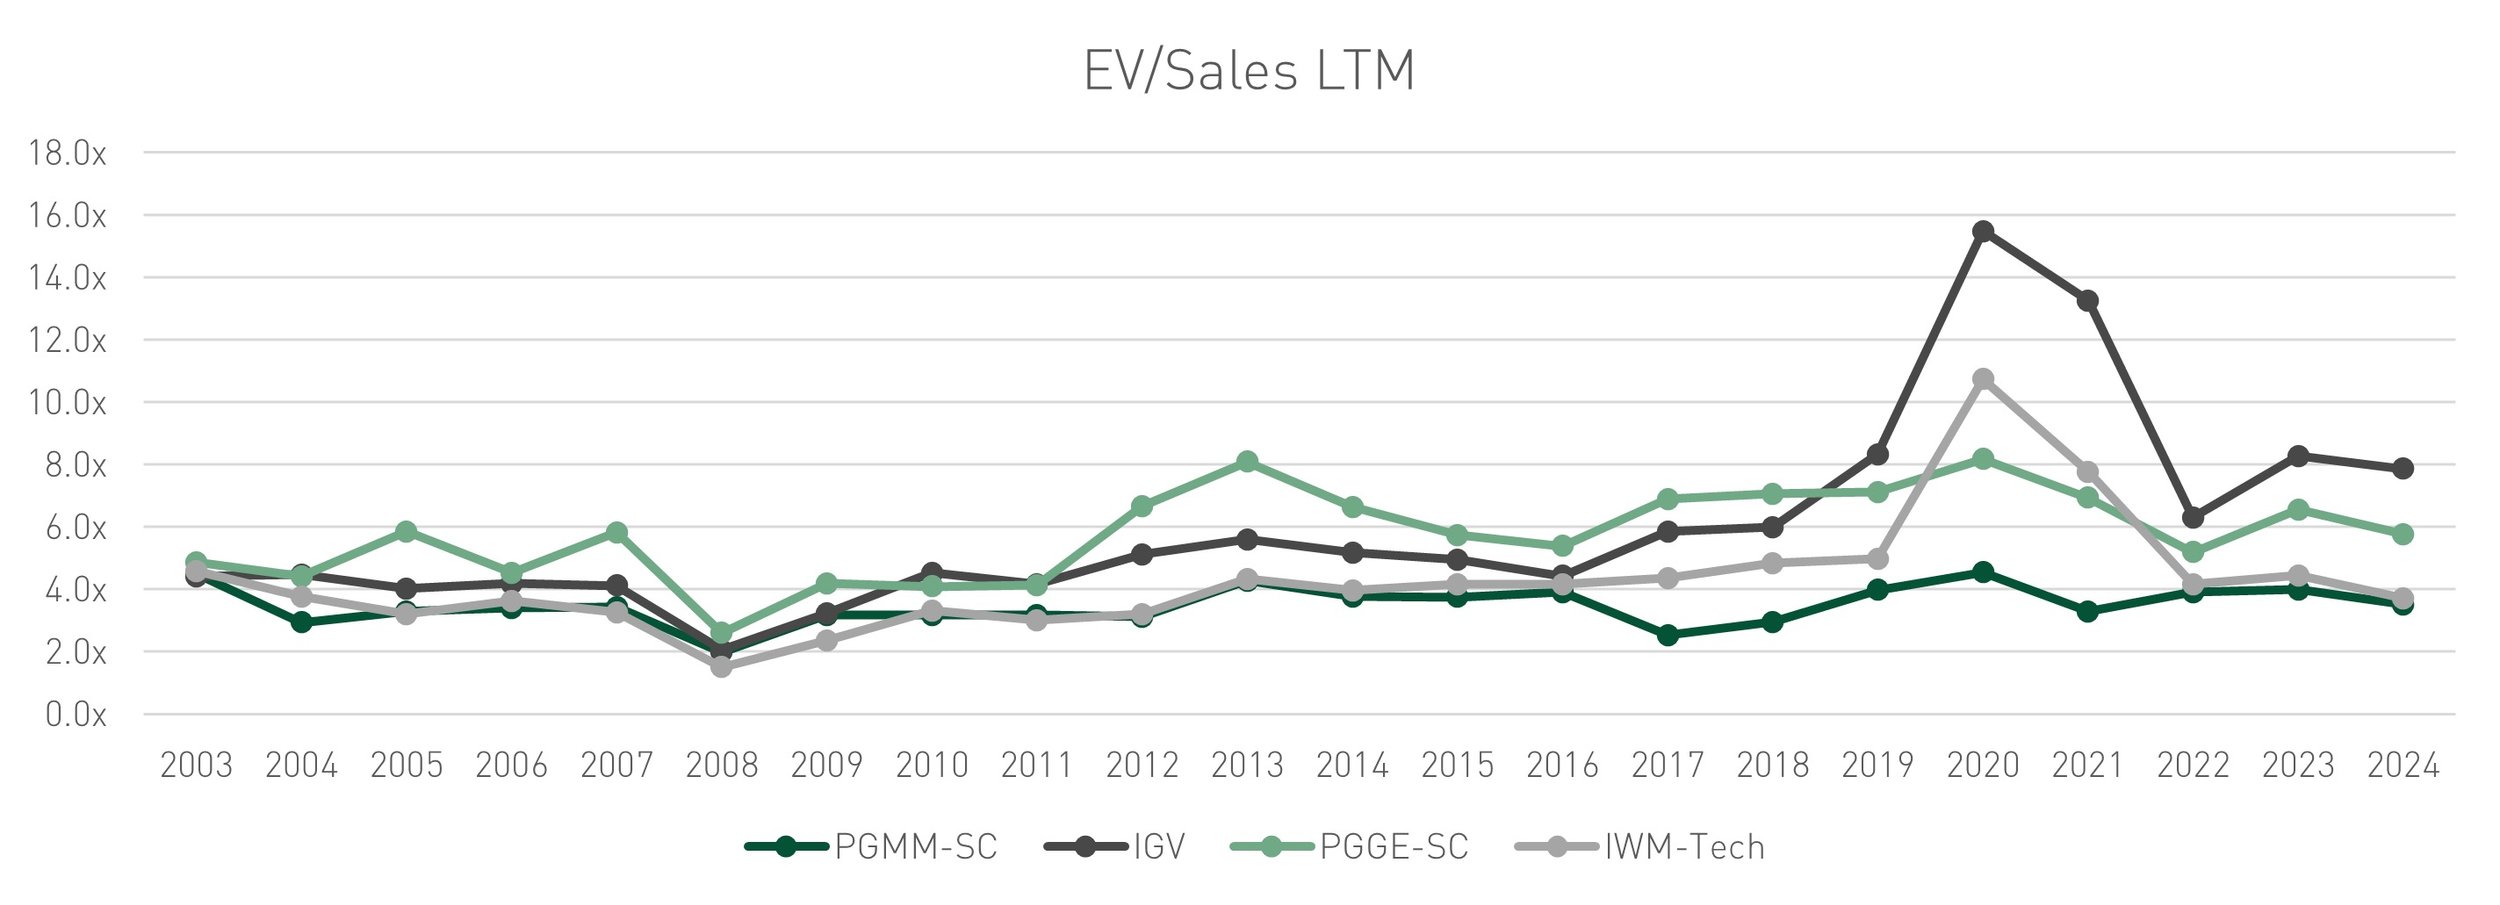
Sales multiples for ParkerGale Middle Market Buyout (PGMM) were stable at 7.5x revenue in the first quarter while sales multiples for ParkerGale Growth Equity (PGGE) decreased a turn to 9.0x on average. PGGE traded at a premium over PGMM and the iShares Expanded Tech-Software Sector ETF (IGV) which averaged 7.9x revenue.
The line chart below contains sales multiples for PGMM and PGGE compared to IGV. The gap between sales multiples contracted a turn compared to last quarter. PGGE companies have increased profitability levels again but growth is decelerating. Market sentiment shows that investors are still trying to understand what the new baseline for “fast growth” companies will look like. Although last quarter many management teams stated that budgets and growth rateshad stabilized, the most recent quarter reporting showed that analysts do not yet agree on what fast growth looks like in the current environment.

This quarter, 20 out of 83 PGMM companies were valued at 10x EV/Sales or higher. Those companies grew revenue 14%, had EBITDA margins of 36%, and traded at 41x EBITDA, a premium over the PGMM index. In PGGE, only four companies were valued at 10x EV/Sales or higher and grew revenue on average 31% with EBITDA margins of 15%. Revenue growth for those companies decreased compared to last quarter, but EBITDA margins were stable.Additionally, that subsegment of PGGE traded at a premium, averaging 14x EV/Sales.
The first quarter average LTM sales multiple for PGMM-SC was 3.5x, below the 4.0x to 4.5x range experienced over the last four quarters. Again, PGGE-SC is not meaningful because the index contained one company, Klaviyo. Klaviyo, one of the handful of software IPOs since 2022, is growing at 29% and profitable, trading at 5.8x revenue and 20x EBITDA, close to long term averages for PGMM.
YoY Sales Growth
Below we chart annual sales growth. Revenue growth for PGGE ended at 30%, a deceleration from 36% in the previous quarter. PGMM grew 13%, slightly below 14% in the previous quarter.

At the end of 2023, available estimates showed that companies were expected to grow 28% in PGGE and 10% in PGMM. Now that we have first quarter data, more companies have provided 2024 outlooks. Many companies reported disappointing outlooks for 2024, with companies seeing a precipitous drop in their stock price after beating estimates but missing forward looking growth expectations. On a go-forward basis, underwriting to high-teens next twelve-month revenue growth rates for software companies seems like a reasonable expectation, especially given the companies have been able to achieve profitability over the past two years.
EV/EBITDA
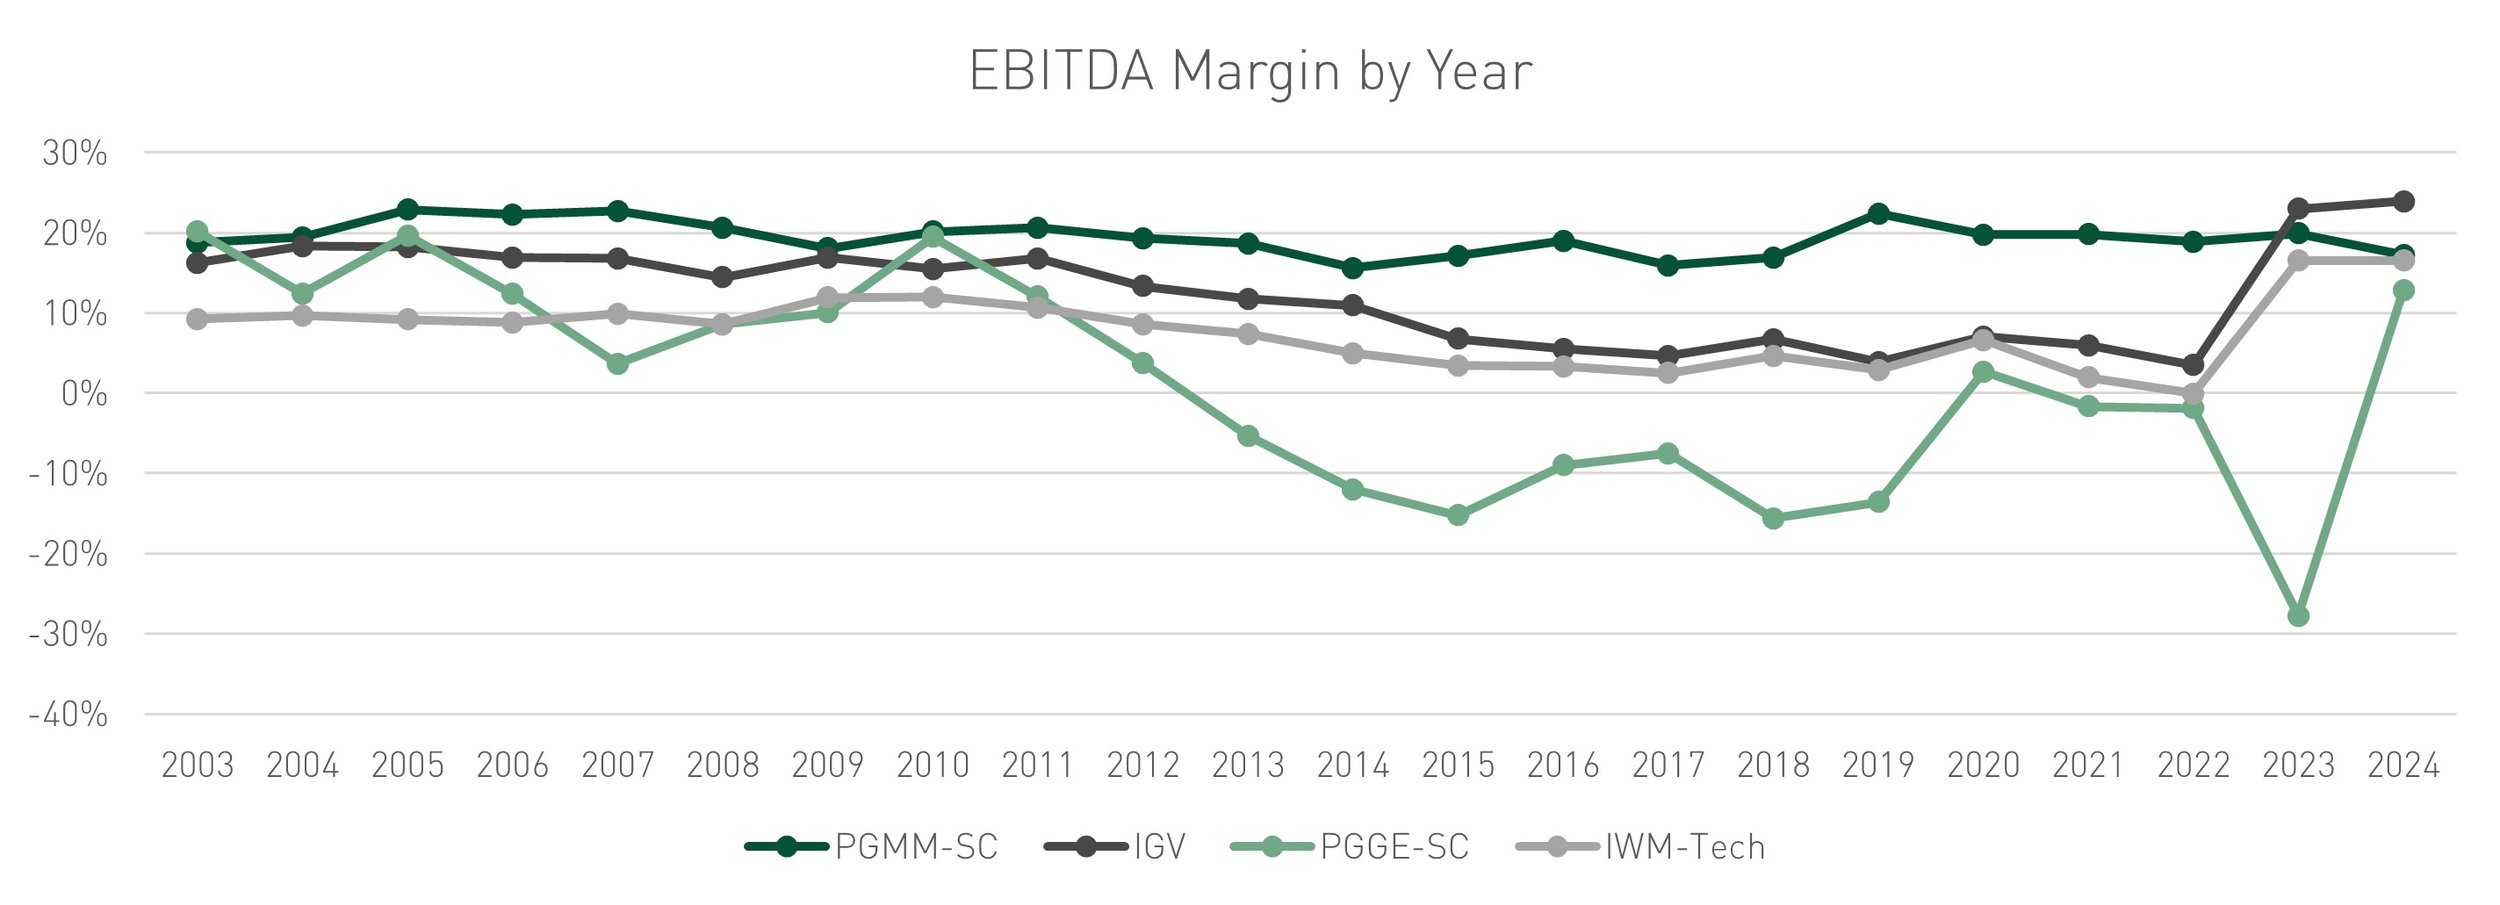
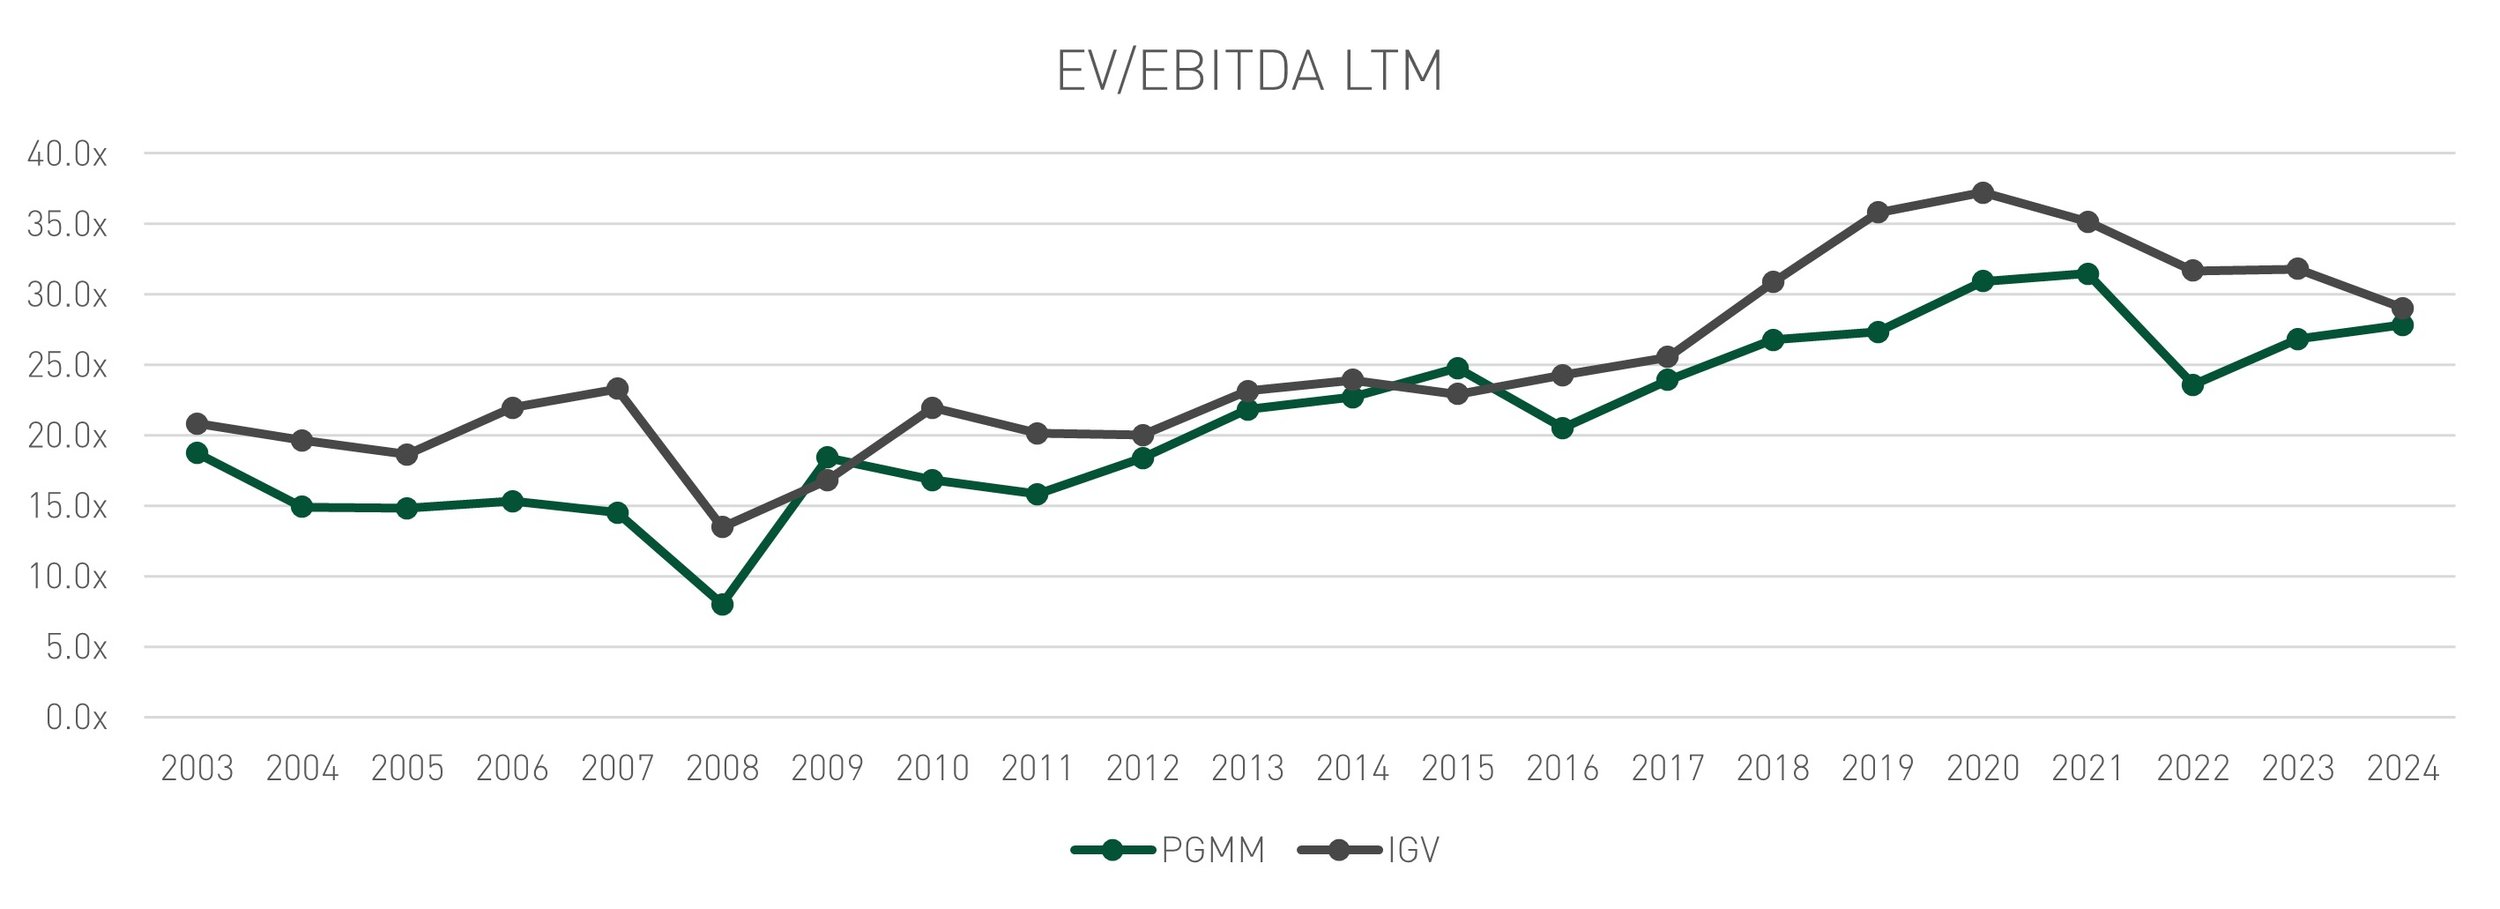
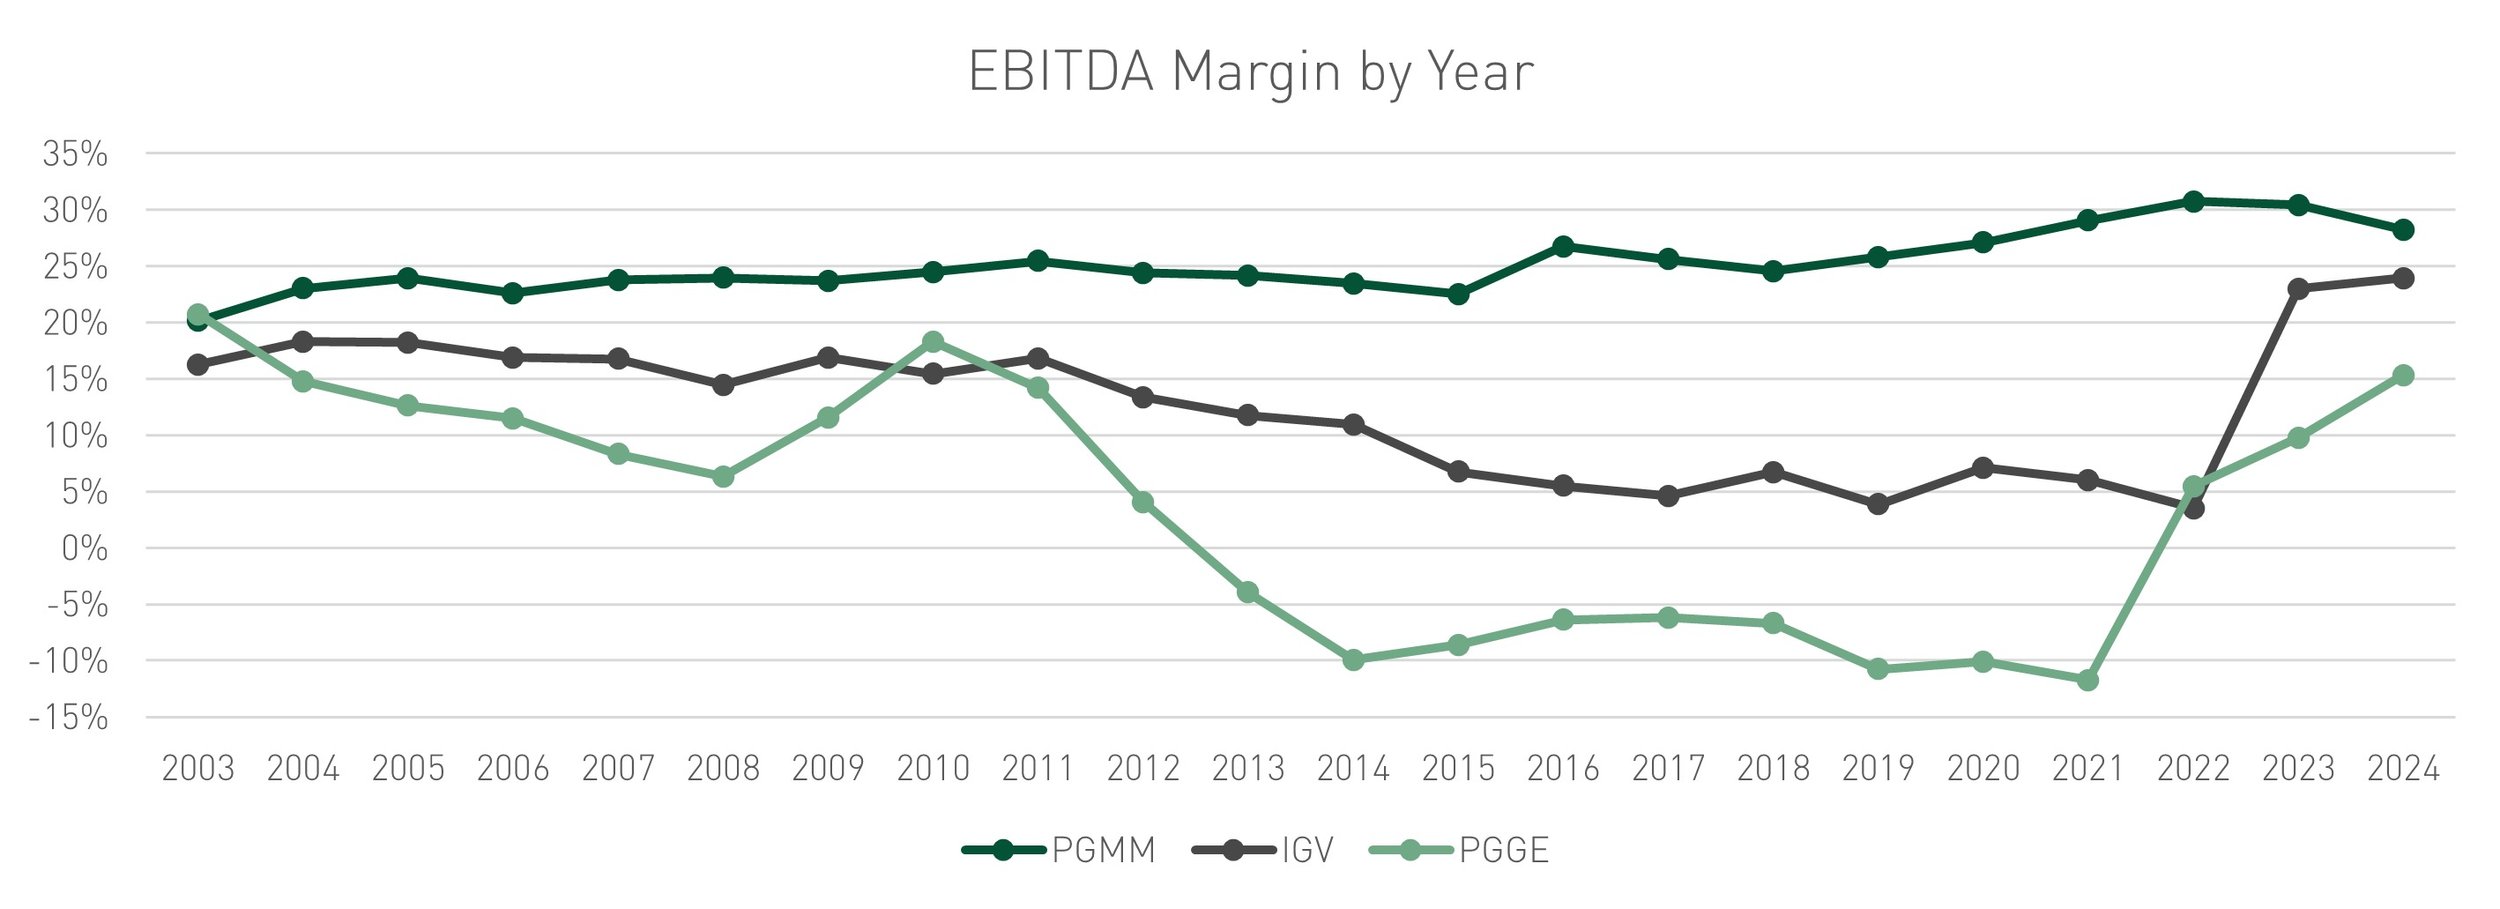
Finally, we examine EBITDA margins and multiples for our indices. EBITDA multiples for PGMM were in line as margins went to 28% from 30%. PGMM-SC had margins of 17% on average and traded at 19.4x EBITDA, providing a base line for exit expectations.
Last quarter we highlighted that most companies in our PGGE index succeeded in transitioning from growth to profitability over the course of 2023. That trend continues as the cohort has 15% EBITDA margins. PGGE companies that were able to exceed the group EBITDA margin averagecommanded a premium valuation. Next twelve-month growth rates at the end of the first quarter were 33% for PGGE, with 10% EBITDA margins.


We revisit the historical Rule of 40 to map how companies are achieving the metric. PGMM has consistently stayed in the high 20% EBITDA margin range and teens revenue growth range. Over time, PGGE has decelerated in growth and relied more on EBITDA margins to achieve Rule of 40.
Despite the talk about focusing on profits, PGMM growth rates didn’t suffer. As a result, valuation changes throughout the year did not vary widely. And this provides more insight for folks that appreciate reasonable growth and profits, particularly for private equity investors like us.
Conclusion
Major talking points coming out of first quarter earnings include disappointing outlooks, scrutinized budgets, cost rationalization of labor, and a low likelihood that interest rates are driving lackluster performance.
Companies that beat earnings and maintained guidance weren’t necessarily rewarded in their stock price. Companies that saw negative price action beat modestly but came inline or reduced their next quarter guidance. Overall, even when fiscal year guidance stayed the same, analysts called out that near term weakness was more indicative of trend than confidence in a back halfrevenue acceleration. Digesting the S&P 1500 IT Index as an indicator, most companies reported first quarter revenue and earnings above consensus. That data supports that investor concern centers on long-term revenue deceleration.
Investor appetite for growth is increasing, but it is hard to find companies that are both growing fast and able to build momentum throughout the year. Valuations for companies that were able to maintain growth and be profitable have seen their valuations rewarded. And maybe the M&A environment is showing that in a period of stagnation or stabilization in growth, it’s worthwhile to buy at the median, hoping that opportunity for multiple expansion will come. Especially as the IPO window is “closed”.
In context of the 20-year average, software valuations are in line. The long-term average is around 6x revenue, like IGV at 7.9x, with PGMM trading at a discount (3.5x) and PGGE trading at a premium (7.5x). The last ten years of U.S.-based software take-privates averaged 4.4x LTM revenue, with an average range of 3x to 6x. Given there is a lot of capital available in private markets and it is hard to get rewarded as a public company for consistent growth and profitability, I would anticipate that takeout activity could increase over the back half of 2024.
Disclosures
Actual financial data and estimates for the calendar year ending 2024 were pulled from FactSet as of 6/23/2024.
Investing involves risk, including the loss of all or a significant portion of amounts invested. Past performance is not a guarantee of future results.
The information contained herein is for informational purposes only and should not be considered investment advice. Opinions, estimates, forecasts, and statements of financial market trends that are based on current market conditions constitutes our judgment and are subject to change without notice. All information with respect to industry data has been obtained from sources believed to be reliable and current, but accuracy cannot be guaranteed. Certain economic and market information contained herein has been obtained from published sources and/or prepared by other parties and current as of the date of publication shown.
Investors cannot invest directly in an index. Indices may change over time. Indices are not an investment and, therefore, have no investment performance history. Index performance does not include risks, fees, or other costs. Past index performance is no indication of future results for the index or for any investment.
IWM-Tech – Consists of all Packaged Software stocks as classified by FactSet within the iShares Russell 2000 ETF (IWM). The iShares Russell 2000 ETF (IWM) seeks to track the investment results of an index composed of small-capitalization U.S. equities.
IGV - iShares Expanded Tech-Software Sector ETF – The iShares Expanded Tech-Software Sector ETF seeks to track the investment results of an index composed of North American equities in the software industry and select North American equities from interactive home entertainment and interactive media and services industries.